
Introduction
Matplotlib is one of the most widely used data visualization libraries in Python. Much of Matplotlib's popularity comes from its customization options - you can tweak just about any element from its hierarchy of objects.
In this tutorial, we'll take a look at how to change a figure size in Matplotlib.
Creating a Plot
Let's first create a simple plot in a figure:
import matplotlib.pyplot as plt
import numpy as np
x = np.arange(0, 10, 0.1)
y = np.sin(x)
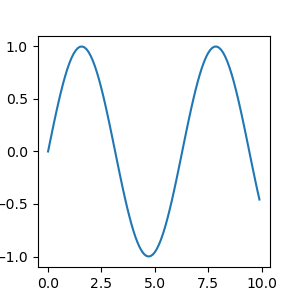
plt.plot(x, y)
plt.show()
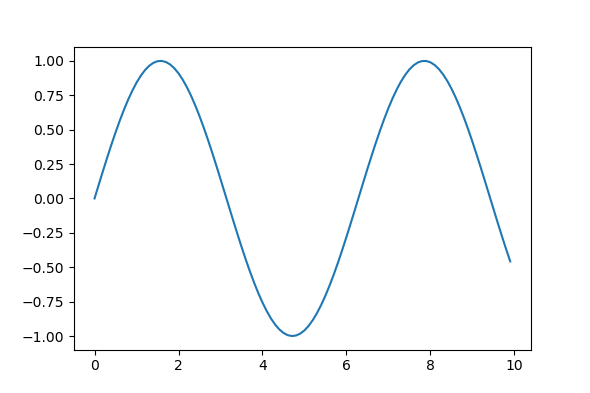
Here, we've plotted a sine function, starting at 0 and ending at 10 with a step of 0.1. Running this code yields:

The Figure object, if not explicitly created, is created by default and contains all the elements we can and cannot see. Changing the size of the Figure will in turn change the size of the observable elements too.
Let's take a look at how we can change the figure size.
Change Figure Size in Matplotlib
Set the figsize Argument
First off, the easiest way to change the size of a figure is to use the figsize argument. You can use this argument either in Pyplot's initialization or on an existing Figure object.
Let's first modify it during initialization:
import matplotlib.pyplot as plt
import numpy as np

x = np.arange(0, 10, 0.1)
y = np.sin(x)

plt.figure(figsize=(3, 3))
plt.plot(x, y)
plt.show()
Here, we've accessed the Figure instance that was created by default and passed the figsize argument. Note that the size is defined in inches, not pixels. This will result in a figure that's 3in by 3in in size:
Matplotlib/PyPlot don't currently support metric sizes, though, it's easy to write a helper function to convert between the two:
def cm_to_inch(value):
    return value/2.54
And then adjust the size of the plot like this:
plt.figure(figsize=(cm_to_inch(15),cm_to_inch(10)))
This would create a plot with the size of 15cm by 10cm:
Alternatively, if you're creating a Figure object for your plot, you can assign the size at that time:
import matplotlib.pyplot as plt
import numpy as np

x = np.arange(0, 10, 0.1)
y = np.sin(x)
z = np.cos(x)

fig = plt.figure(figsize=(8, 6))

# Adds subplot on position 1
ax = fig.add_subplot(121)
# Adds subplot on position 2
ax2 = fig.add_subplot(122)

ax.plot(x, y)
ax2.plot(x, z)
plt.show()
Here, we've explicitly assigned the return value of the figure() function to a Figure object. Then, we can add axes to this figure to create multiple subplots and plot on them.
Check out our hands-on, practical guide to learning Git, with best-practices, industry-accepted standards, and included cheat sheet. Stop Googling Git commands and actually learn it!
We've used the add_subplot() function, which accepts a series of numerical values. The first number specifies how many rows you want to add to the figure, the second number specifies how many columns you want to add, and the third number specifies the number of the plot that you want to add.
This means that if you in passed in 111 into the add_subplots() function, one new subplot would be added to the figure. Meanwhile, if you used the numbers 221, the resulting plot would have four axes with two columns and two rows - and the subplot you're forming is in the 1st position.
This code results in:

Set the Height and Width of a Figure in Matplotlib
Instead of the figsize argument, we can also set the height and width of a figure. These can be done either via the set() function with the figheight and figwidth argument, or via the set_figheight() and set_figwidth() functions.
The former allows you to write one line for multiple arguments while the latter provides you with code that's more readable.
Let's go with the second option:
import matplotlib.pyplot as plt
import numpy as np

x = np.arange(0, 10, 0.1)
y = np.sin(x)
z = np.cos(x)

fig = plt.figure()

fig.set_figheight(5)
fig.set_figwidth(10)

# Adds subplot on position 1
ax = fig.add_subplot(121)
# Adds subplot on position 2
ax2 = fig.add_subplot(122)

ax.plot(x, y)
ax2.plot(x, z)
plt.show()
This code results in:

Finally, you can also use the set_size_inches() function as well:
fig = plt.figure()

fig.set_size_inches(10, 5)

# Adds subplot on position 1
ax = fig.add_subplot(121)
# Adds subplot on position 2
ax2 = fig.add_subplot(122)

ax.plot(x, y)
ax2.plot(x, z)
plt.show()
And this performs the same as setting the figsize argument or using the two functions:

Conclusion
In this tutorial, we've gone over several ways to change the size of a figure in Matplotlib.
If you're interested in Data Visualization and don't know where to start, make sure to check out our book on Data Visualization in Python.
If you're interested in Data Visualization and don't know where to start, make sure to check out our bundle of books on Data Visualization in Python:

Data Visualization in Python with Matplotlib and Pandas is a book designed to take absolute beginners to Pandas and Matplotlib, with basic Python knowledge, and allow them to build a strong foundation for advanced work with theses libraries - from simple plots to animated 3D plots with interactive buttons.
It serves as an in-depth, guide that'll teach you everything you need to know about Pandas and Matplotlib, including how to construct plot types that aren't built into the library itself.
Data Visualization in Python, a book for beginner to intermediate Python developers, guides you through simple data manipulation with Pandas, cover core plotting libraries like Matplotlib and Seaborn, and show you how to take advantage of declarative and experimental libraries like Altair. More specifically, over the span of 11 chapters this book covers 9 Python libraries: Pandas, Matplotlib, Seaborn, Bokeh, Altair, Plotly, GGPlot, GeoPandas, and VisPy.
It serves as a unique, practical guide to Data Visualization, in a plethora of tools you might use in your career.

