
Introduction
Matplotlib is one of the most widely used data visualization libraries in Python. Matplotlib plots and visualizations are commonly shared with others, be it through papers or online.
In this article, we'll take a look at how to save a plot/graph as an image file using Matplotlib.
Creating a Plot
Let's first create a simple plot:
import matplotlib.pyplot as plt
import numpy as np

x = np.arange(0, 10, 0.1)
y = np.sin(x)

plt.plot(x, y)
plt.show()
Here, we've plotted a sine function, starting at 0 and ending at 10 with a step of 0.1. Running this code yields:

Now, let's take a look at how we can save this figure as an image.
Save Plot as Image in Matplotlib
In the previous example, we've generated the plot via the plot() function, passing in the data we'd like to visualize.
This plot is generated, but isn't shown to us, unless we call the show() function. The show() function, as the name suggests, shows the generated plot to the user in a window.
Once generated, we can also save this figure/plot as a file - using the savefig() function:
import matplotlib.pyplot as plt
import numpy as np

x = np.arange(0, 10, 0.1)
y = np.sin(x)

plt.plot(x, y)
plt.savefig('saved_figure.png')
Now, when we run the code, instead of a window popping up with the plot, we've got a file (saved_figure.png) in our project's directory.
This file contains the exact same image we'd be shown in the window:

It's worth noting that the savefig() function isn't unique to the plt instance. You can also use it on a Figure object:
import matplotlib.pyplot as plt
import numpy as np

fig = plt.figure()

x = np.arange(0, 10, 0.1)
y = np.sin(x)

plt.plot(x, y)
fig.savefig('saved_figure.png')
The savefig() function has a mandatory filename argument. Here, we've specified the filename and format.
Additionally, it accepts other options, such as dpi, transparent, bbox_inches, quality, etc.
We'll go over some popular options in the proceeding sections.
Setting Image DPI
The DPI parameter defines the number of dots (pixels) per inch. This is essentially the resolution of the image we're producing. Let's test out a couple of different options:
import matplotlib.pyplot as plt
import numpy as np

fig = plt.figure()

x = np.arange(0, 10, 0.1)
y = np.sin(x)

plt.plot(x, y)
fig.savefig('saved_figure-50pi.png', dpi = 50)
fig.savefig('saved_figure-100dpi.png', dpi = 100)
fig.savefig('saved_figure-1000dpi.png', dpi = 1000)
This results in three new image files on our local machine, each with a different DPI:
Check out our hands-on, practical guide to learning Git, with best-practices, industry-accepted standards, and included cheat sheet. Stop Googling Git commands and actually learn it!
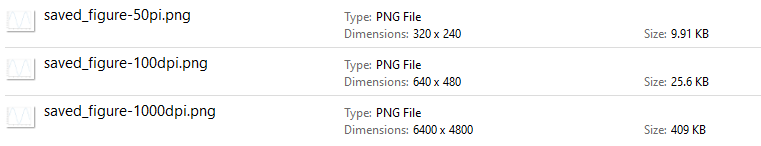
The default value is 100.
Save Transparent Image with Matplotlib
The transparent argument can be used to create a plot with a transparent background. This is useful if you'll use the plot image in a presentation, on a paper or would like to present it in a custom design setting:
import matplotlib.pyplot as plt
import numpy as np
x = np.arange(0, 10, 0.1)
y = np.sin(x)
plt.plot(x, y)
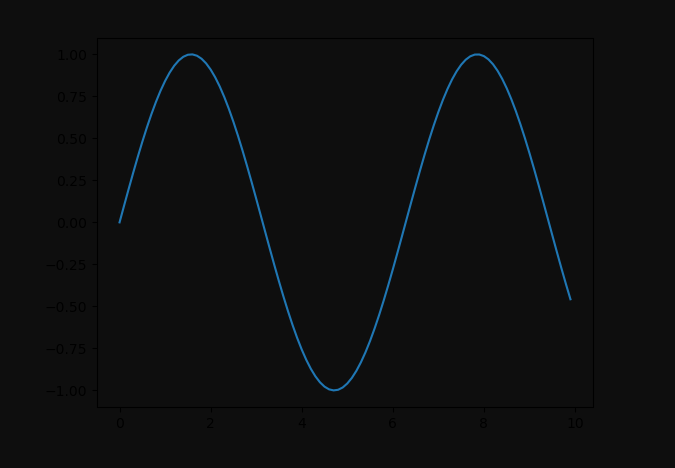
plt.savefig('saved_figure.png', transparent=True)
If we put this image on a dark background, it'll result in:
Changing Plot Colors
You can change the face color by using the facecolor argument. It accepts a color and defaults to white.
Let's change it to red:
import matplotlib.pyplot as plt
import numpy as np
x = np.arange(0, 10, 0.1)
y = np.sin(x)
plt.plot(x, y)
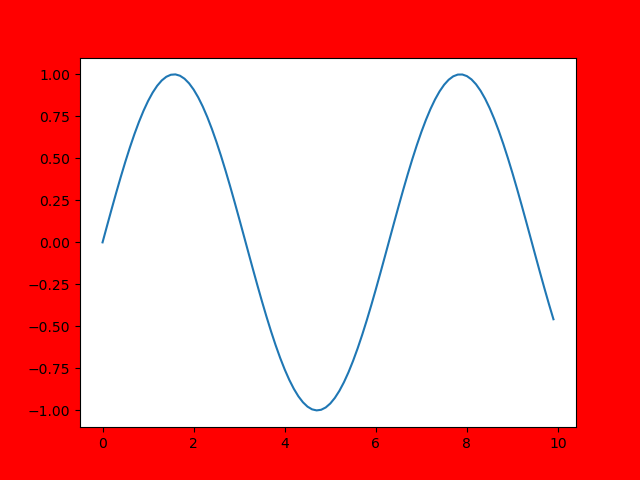
plt.savefig('saved_figure-colored.png', facecolor = 'red')
This results in:
Setting Image Border Box
The bbox_inches argument accepts a string and specifies the border around the box we're plotting. If we'd like to set it to be tight, i.e. to crop around the box as much as possible, we can set the bbox_inches argument to 'tight':
import matplotlib.pyplot as plt
import numpy as np
x = np.arange(0, 10, 0.1)
y = np.sin(x)
plt.plot(x, y)
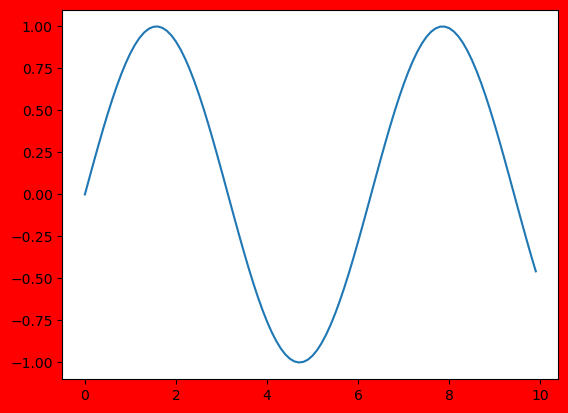
plt.savefig('saved_figure-tight.png', bbox_inches = 'tight', facecolor='red')
This results in a tightly packed box. This is easier to visualize if we color the face with a different color for reference:
Conclusion
In this tutorial, we've gone over several ways to save the plot as an image file using Matplotlib.
If you're interested in Data Visualization and don't know where to start, make sure to check out our bundle of books on Data Visualization in Python:

Data Visualization in Python with Matplotlib and Pandas is a book designed to take absolute beginners to Pandas and Matplotlib, with basic Python knowledge, and allow them to build a strong foundation for advanced work with these libraries - from simple plots to animated 3D plots with interactive buttons.
It serves as an in-depth guide that'll teach you everything you need to know about Pandas and Matplotlib, including how to construct plot types that aren't built into the library itself.
Data Visualization in Python, a book for beginner to intermediate Python developers, guides you through simple data manipulation with Pandas, covers core plotting libraries like Matplotlib and Seaborn, and shows you how to take advantage of declarative and experimental libraries like Altair. More specifically, over the span of 11 chapters this book covers 9 Python libraries: Pandas, Matplotlib, Seaborn, Bokeh, Altair, Plotly, GGPlot, GeoPandas, and VisPy.
It serves as a unique, practical guide to Data Visualization, in a plethora of tools you might use in your career.

