
Missing values are common and occur either due to human error, instrument error, processing from another team, or otherwise just a lack of data for a certain observation.
In this Byte, we'll take a look at how to fill NaNs in a
DataFrame, if you choose to handle NaNs by filling them.
First off, let's create a mock DataFrame with some random values dropped out:
import numpy as np
array = np.random.randn(25, 3)
mask = np.random.choice([1, 0], array.shape, p=[.3, .7]).astype(bool)
array[mask] = np.nan

df = pd.DataFrame(array, columns=['Col1', 'Col2', 'Col3'])
        Col1      Col2      Col3
0  -0.671603 -0.792415  0.783922
1   0.207720       NaN  0.996131
2  -0.892115 -1.282333       NaN
3  -0.315598 -2.371529 -1.959646
4        NaN       NaN -0.584636
5   0.314736 -0.692732 -0.303951
6   0.355121       NaN       NaN
7        NaN -1.900148  1.230828
8  -1.795468  0.490953       NaN
9  -0.678491 -0.087815       NaN
10  0.755714  0.550589 -0.702019
11  0.951908 -0.529933  0.344544
12       NaN  0.075340 -0.187669
13       NaN  0.314342 -0.936066
14       NaN  1.293355  0.098964
Let's plot, say, the third column:
plt.plot(df['Col3'])
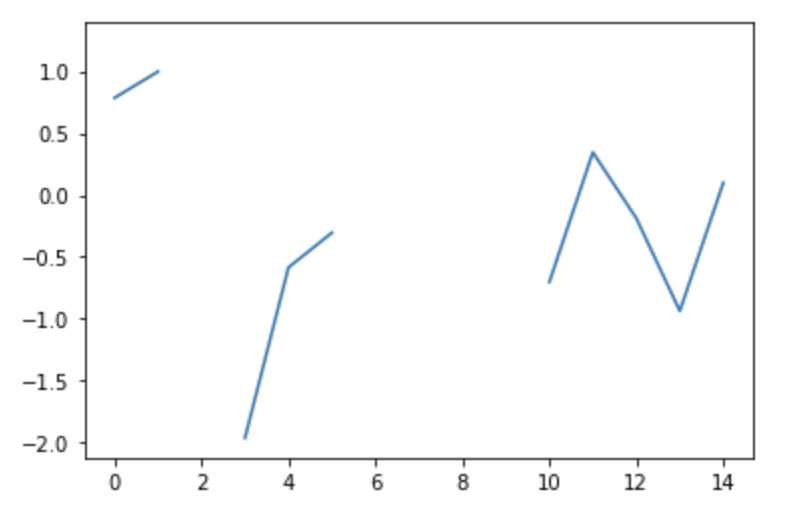
When filled with various techniques - this NaN-filled graph can be replaced with:

fillna() - Mean, Median, Mode
You can fill these values into a new column and assign it to the column you wish to fill, or in-place using the inplace argument. Here, we'll be extracting the filled values in a new column for ease of inspection:
mean = df['Col3'].fillna(df['Col3'].mean(), inplace=False)
median = df['Col3'].fillna(df['Col3'].median(), inplace=False)
mode = df['Col3'].fillna(df['Col3'].mode(), inplace=False)
The median, mean and mode of the column are -0.187669, -0.110873 and 0.000000 and these values will be used for each NaN respectively. This is effectively filled with constant values, where the value being input depends on the entirety of the column.
First, filling with median values results in:

With mean values:

With mode values:

fillna() - Constant Value
You can also fill with a constant value instead:
Check out our hands-on, practical guide to learning Git, with best-practices, industry-accepted standards, and included cheat sheet. Stop Googling Git commands and actually learn it!
constant = df['Col3'].fillna(0, inplace=False
This results in a constant value (0) being put instead of each NaN. 0 is close to our median and mean and equal to the mode, so the filled values will resemble that method closely for our mock dataset:
0     0.783922
1     0.996131
2     0.000000
3    -1.959646
4    -0.584636
5    -0.303951
6     0.000000
7     1.230828
8     0.000000
9     0.000000
10   -0.702019
11    0.344544
12   -0.187669
13   -0.936066
14    0.098964

fillna() - Forward and Backward Fill
On each row - you can do a forward or backward fill, taking the value either from the row before or after:
ffill = df['Col3'].fillna(method='ffill')
bfill = df['Col3'].fillna(method='bfill')
With forward-filling, since we're missing from row 2 - the value from row 1 is taken to fill the second one. The values propagate forward:
0     0.783922
1     0.996131
2     0.996131
3    -1.959646
4    -0.584636
5    -0.303951
6    -0.303951
7     1.230828
8     1.230828
9     1.230828
10   -0.702019
11    0.344544
12   -0.187669
13   -0.936066
14    0.098964

With backward-filling, the opposite happens. Row 2 is filled with the value from row 3:
0     0.783922
1     0.996131
2    -1.959646
3    -1.959646
4    -0.584636
5    -0.303951
6     1.230828
7     1.230828
8    -0.702019
9    -0.702019
10   -0.702019
11    0.344544
12   -0.187669
13   -0.936066
14    0.098964

Though, if there's more than one NaN in a sequence - these won't do well and can cascade NaNs further down, skewing the data and removing actually recorded values.
interpolate()
The interpolate() method delegates the interpolation of values to SciPy's suite of methods for interpolating values. It accepts a wide variety of arguments, including, nearest, zero, slinear, quadratic, cubic, spline, barycentric, polynomial, krogh, piecewise_polynomial, spline, pchip, akima, cubicspline, etc.
Interpolation is much more flexible and "smart" than just filling values with constants or half-variables such as previous methods.
Interpolation can properly fill a sequence in a way that no other methods can, such as:
s = pd.Series([0, 1, np.nan, np.nan, np.nan, 5])
s.fillna(s.mean()).values
# array([0., 1., 2., 2., 2., 5.])
s.fillna(method='ffill').values
# array([0., 1., 1., 1., 1., 5.])
s.interpolate().values
# array([0., 1., 2., 3., 4., 5.])
The default interpolation is linear, and assuming that 1...5 is likely a 1, 2, 3, 4, 5 sequence isn't far-fetched (but isn't guaranteed). Both constant filling and forward or backward-filling fail miserably here. Generally speaking - interpolation is usually going to be a good friend when it comes to filling NaNs in noisy signals, or corrupt datasets.
Experimenting with types of interpolation may yield better results.
Here are two interpolation methods (splice and polynomial require an order argument):
nearest = df['Col3'].interpolate(method='nearest')
polynomial = df['Col3'].interpolate(method='polynomial', order=3)
These result in:

And:


